
The modules on hypothesis testing presented techniques for testing the equality of means in two independent samples. An underlying assumption for appropriate use of the tests described was that the continuous outcome was approximately normally distributed or that the samples were sufficiently large (usually n1> 30 and n2> 30) to justify their use based on the Central Limit Theorem. When comparing two independent samples when the outcome is not normally distributed and the samples are small, a nonparametric test is appropriate.
A popular nonparametric test to compare outcomes between two independent groups is the Mann Whitney U test. The Mann Whitney U test, sometimes called the Mann Whitney Wilcoxon Test or the Wilcoxon Rank Sum Test, is used to test whether two samples are likely to derive from the same population (i.e., that the two populations have the same shape). Some investigators interpret this test as comparing the medians between the two populations. Recall that the parametric test compares the means (H0: μ1=μ2) between independent groups.
In contrast, the null and two-sided research hypotheses for the nonparametric test are stated as follows:
H0: The two populations are equal versus
H1: The two populations are not equal.
This test is often performed as a two-sided test and, thus, the research hypothesis indicates that the populations are not equal as opposed to specifying directionality. A one-sided research hypothesis is used if interest lies in detecting a positive or negative shift in one population as compared to the other. The procedure for the test involves pooling the observations from the two samples into one combined sample, keeping track of which sample each observation comes from, and then ranking lowest to highest from 1 to n1+n2, respectively.
Consider a Phase II clinical trial designed to investigate the effectiveness of a new drug to reduce symptoms of asthma in children. A total of n=10 participants are randomized to receive either the new drug or a placebo. Participants are asked to record the number of episodes of shortness of breath over a 1 week period following receipt of the assigned treatment. The data are shown below.
Placebo
New Drug
Is there a difference in the number of episodes of shortness of breath over a 1 week period in participants receiving the new drug as compared to those receiving the placebo? By inspection, it appears that participants receiving the placebo have more episodes of shortness of breath, but is this statistically significant?
In this example, the outcome is a count and in this sample the data do not follow a normal distribution.
Frequency Histogram of Number of Episodes of Shortness of Breath
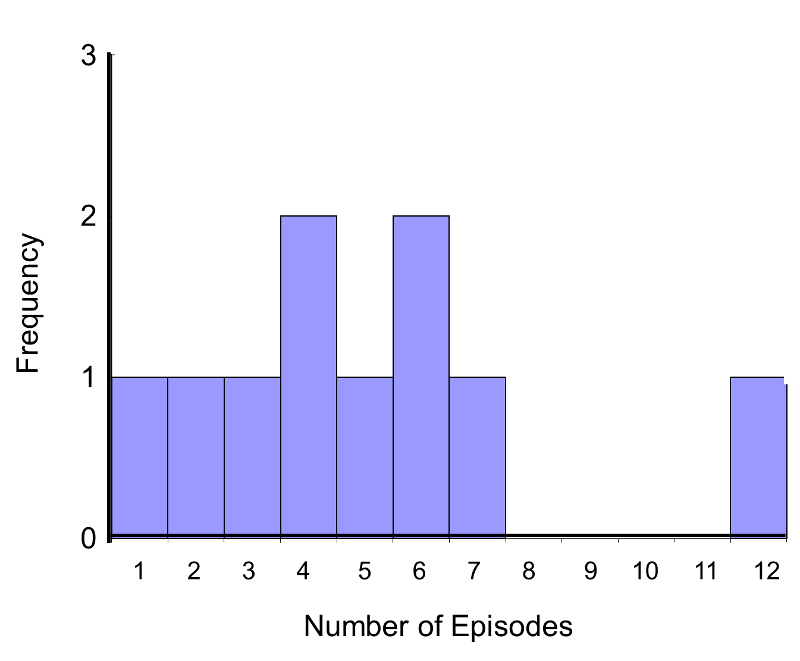
In addition, the sample size is small (n1=n2=5), so a nonparametric test is appropriate. The hypothesis is given below, and we run the test at the 5% level of significance (i.e., α=0.05).
H0: The two populations are equal versus
H1: The two populations are not equal.
Note that if the null hypothesis is true (i.e., the two populations are equal), we expect to see similar numbers of episodes of shortness of breath in each of the two treatment groups, and we would expect to see some participants reporting few episodes and some reporting more episodes in each group. This does not appear to be the case with the observed data. A test of hypothesis is needed to determine whether the observed data is evidence of a statistically significant difference in populations.
The first step is to assign ranks and to do so we order the data from smallest to largest. This is done on the combined or total sample (i.e., pooling the data from the two treatment groups (n=10)), and assigning ranks from 1 to 10, as follows. We also need to keep track of the group assignments in the total sample.
Total Sample
(Ordered Smallest to Largest)
Ranks
Placebo
New Drug
Placebo
New Drug
Placebo
New Drug